CoCoBLAST
CoCoBLAST
Welcome to CoCoBLAST!
How can we find gene regulatory differences between long-diverged species? The answer is coexpression.With CoCoBLAST, you can input a gene of interest within a reference species and search for genes with conserved coexpression partners in a target species.
To explore conserved genes across species, go here!
The wide breadth of species surveyed
We use aggregate coexpression networks from CoCoCoNet 1 for 37 species chosen for their high quality RNA-seq expression data and orthology predictions from OrthoDB 2 . This large collection of data permits the evaluation of coexpression conservation across the tree of life: from fungi to animals to plants.Our co-expression conservation metric
To quantify gene similarity between each pair of species, we compare each gene’s top coexpression partners. We treat this as a supervised learning task, using the ranks of the coexpression strengths from one species to predict the top coexpression partners from the second species, then repeating this task in the opposite direction, finally averaging the scores. We refer to this as a measure of coexpression conservation and note that it is formally equivalent to the average area under the receiver operator characteristic curve (AUROC).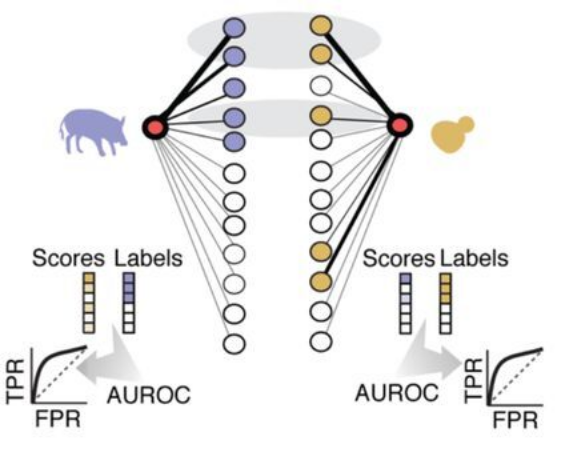
Did you find CoCoBLAST Helpful?
If so, please consider citing us at:Megan Crow, Hamsini Suresh, John Lee, Jesse Gillis,
Coexpression reveals conserved mechanisms of transcriptional cell identity, bioRxiv, 10 Nov, 2020, https://doi.org/10.1101/2020.11.10.375758
Have a question or issue?
Feel free to contact John Hover at hover@cshl.edu to report an issue, suggest an update, or ask for help.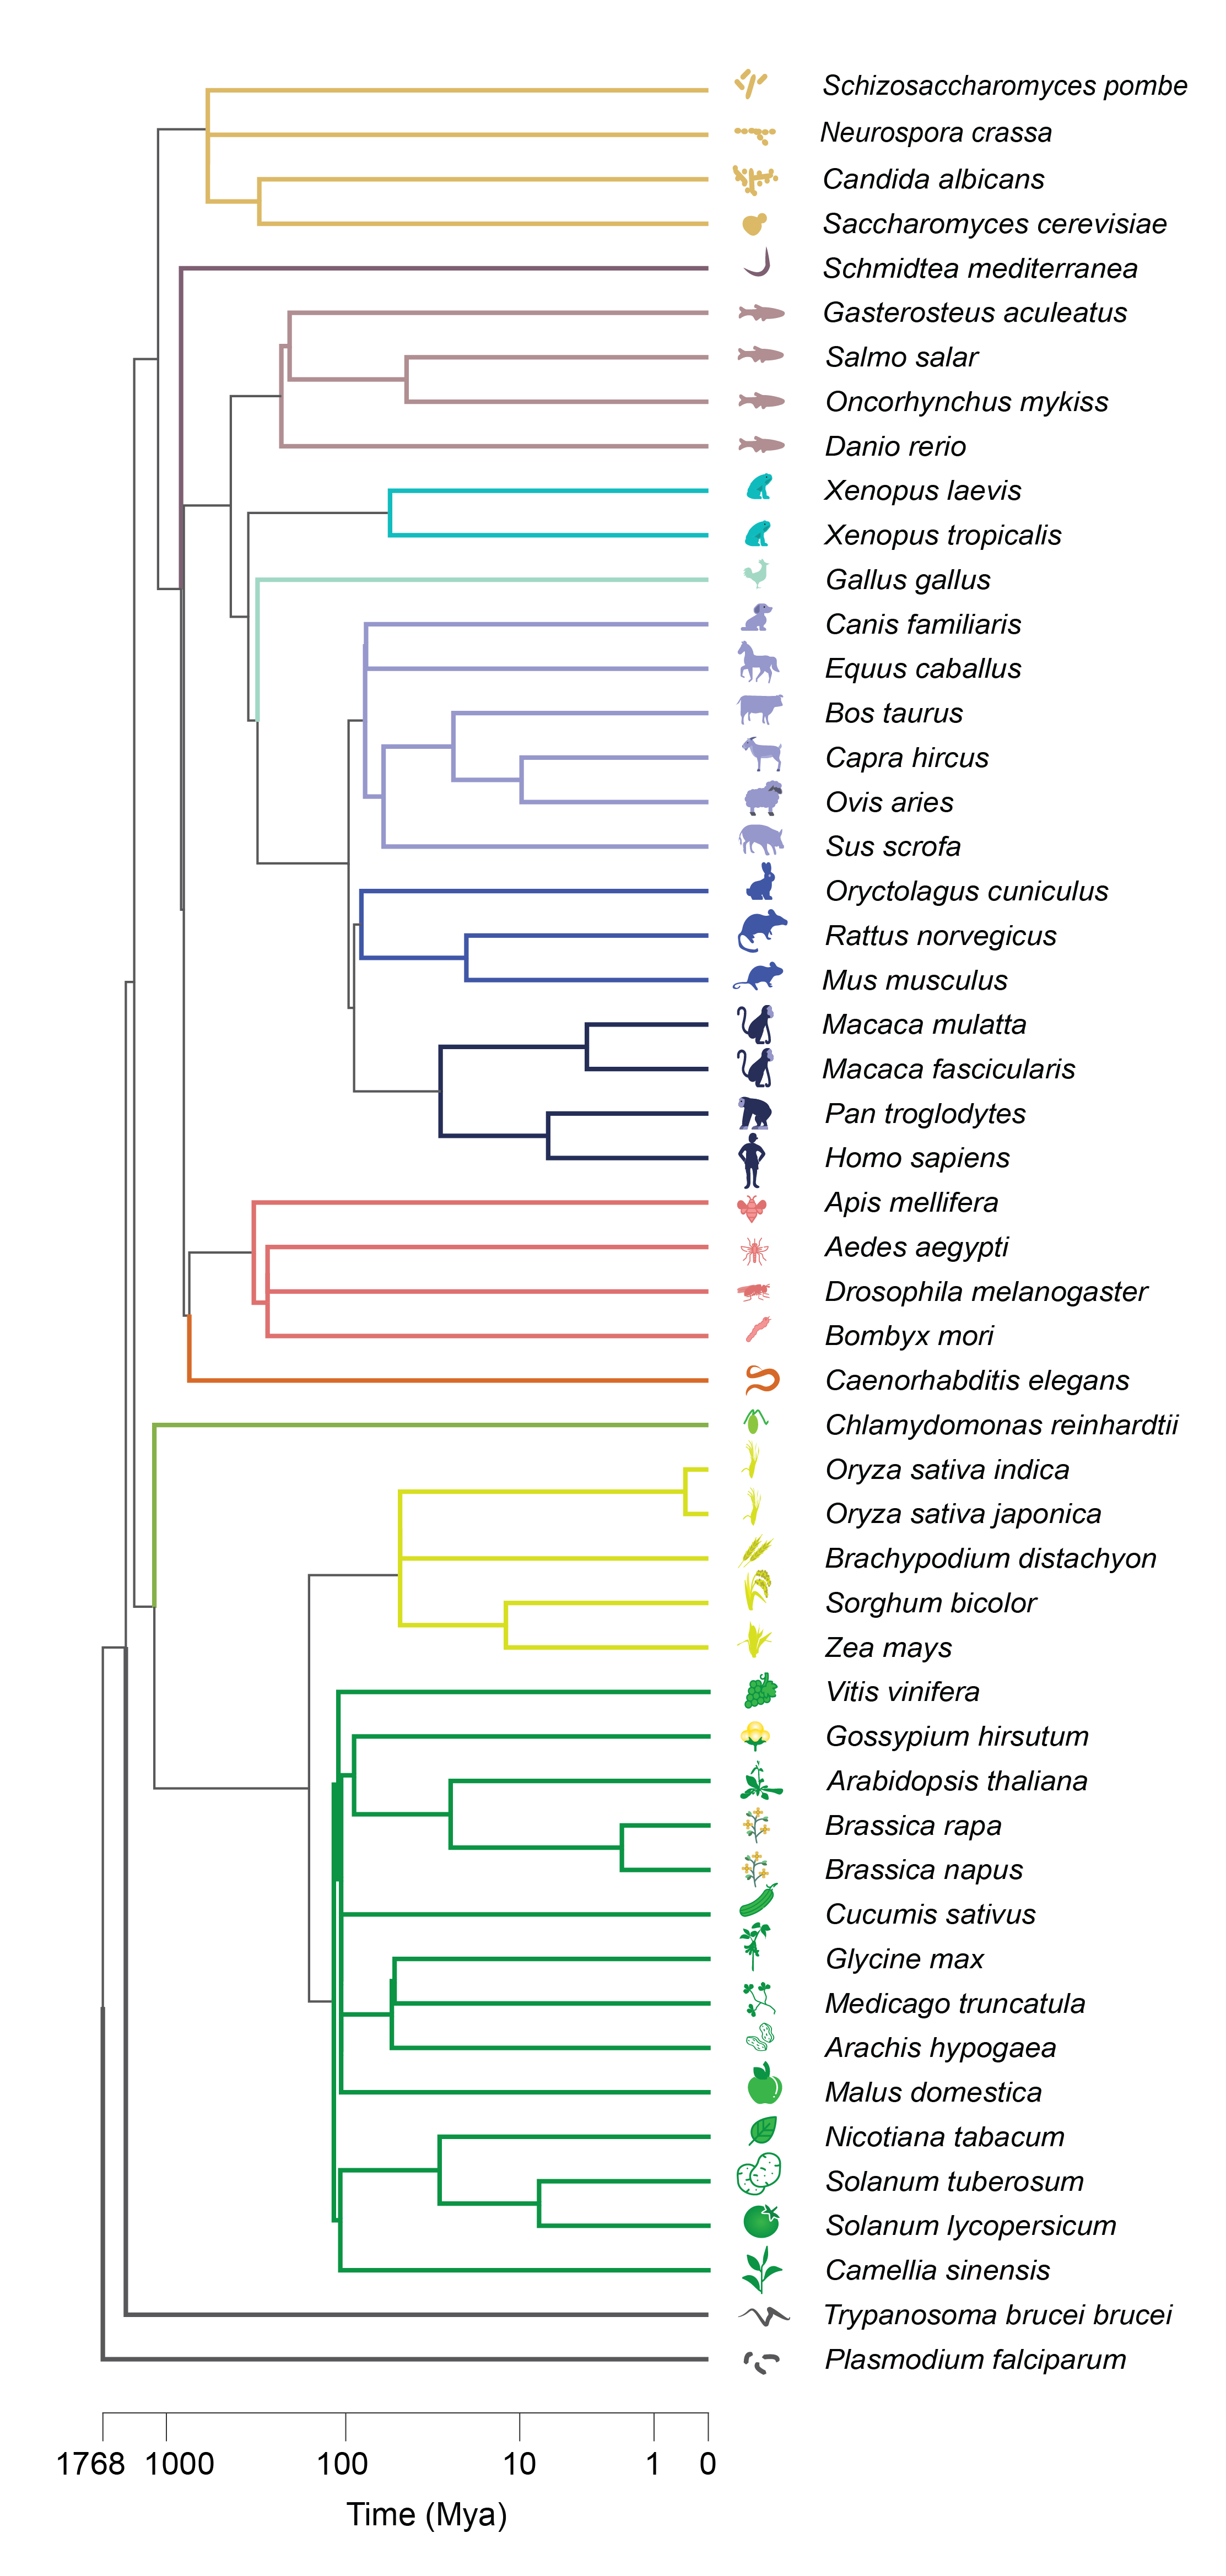
CoCoBLAST
To query co-expression conservation scores, input a gene from a reference species, select a target species, then hit “Submit”. CoCoBLAST will then do several tasks:- It will find the 50 top co-expressed genes in the target species, showing each gene pair’s rank, as well as the reciprocal rank.
- Next, it looks for paralogs for each input gene in the reference species, maps these via orthology to the target species, and plots a heatmap and network of coexpression conservation scores.
- CoCoBLAST also showcases the expression of query genes when mapped to either Tabula Muris 3 or single-cell RNA-seq data from Arabidopsis roots 4, 5, 6, 7 .